Authors:
(1) Matthew Sprintson
(2) Edward Oughton
Table of Links
2. Literature Review
2.1 Reviewing Broadband Infrastructure’s Impact on the Economy
2.2 Previous Research into IO Modeling of Broadband Investment
2.3 Context of the Bipartisan Infrastructure Act through Previous Research
3. Methods and 3.1 Leontief Input-Output (IO) Modeling
3.2 Ghosh Supply-Side Assessment Methods for Infrastructure
4.2 What are the GDP impacts of the three funding programs within the Bipartisan Infrastructure Law?
5. Discussion
5.2 What are the GDP impacts of the three funding programs within the Bipartisan Infrastructure Law?
5.3 How are supply chain linkages affected by allocations from the Bipartisan Infrastructure Law?"
Acknowledgements and References
4 Results
The results are reported for the three research questions defined in the introduction. In section 4.1, we will discuss which states receive broadband investment, in section 4.2, we will report the GDP estimates of our models, and in section 4.3, we will examine the supply-chain linkages associated with the telecommunications sector.
4.1 To what extent does the Bipartisan Infrastructure Law allocate funding to unconnected communities in need?
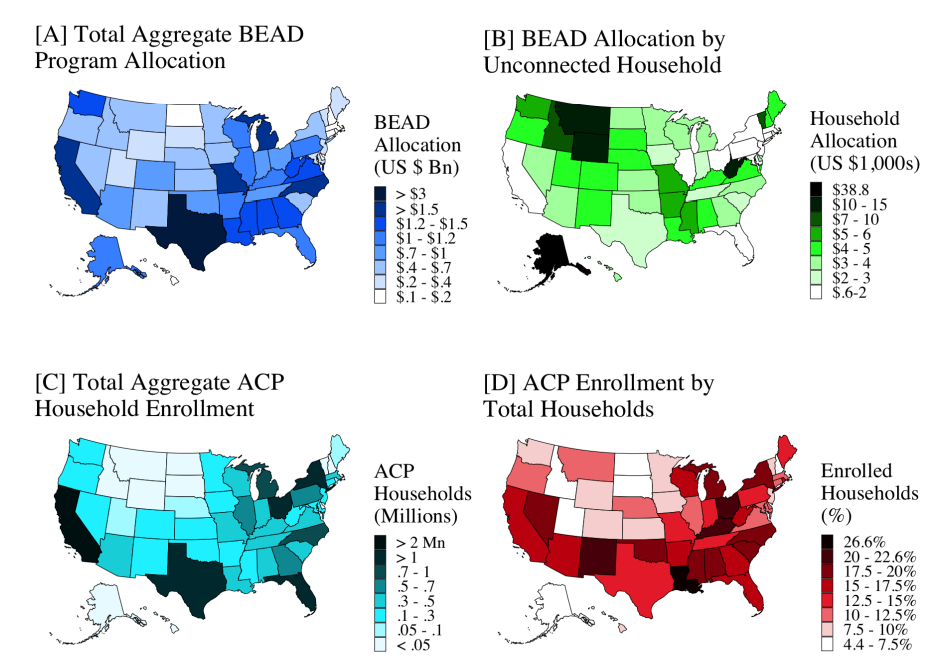
Figure 2 (A) indicates that the states with the highest total BEAD allocation are Texas ($3.31 Bn, 7.80%), California ($1.86 Bn, 4.39%), Missouri ($1.74 Bn, 4.09%), Michigan ($1.56 Bn, 3.67%), and North Carolina ($1.53 Bn, 3.61%). The states with the least include the District of Columbia ($.101 Bn, .24%), Delaware ($.108 Bn, .25%), Rhode Island ($.108 Bn, .26%), and North Dakota ($.130 Bn, .31%)

Figure 2 (B) presents the BEAD allocation using the number of unconnected households as the denominator. Alaska is an outlier, spending US $38,802 per unconnected household (729% higher than the mean per household). Now, Texas and California rank towards the lower end of the spectrum, spending US $2,900 and US $1,796 (38.1% and 61.6% lower than the mean per household). States with a larger rural population, like West Virginia (51.3% Rural), Montana (44.1% rural), and Wyoming (33.2% rural), rank higher now, as they are spending on average US $11,960 per home. Only Alabama (41.0% rural) and Missouri (29.6% rural) rank high by both absolute and relative measures of investment.
ACP Household Enrollment is highly correlated with states that have higher populations, as shown in Figure 2 (C), seeing as states like California (2.30 mn), Texas (1.49 mn), Florida (1.39 mn), New York (1.43 mn), and Ohio (1.00 mn) are those with higher enrollment. However, when we measure enrollment using total households as the denominator in Figure 2 (D), we see a different ranking. High-enrollment states show relatively average enrollment per household, like California (2.30 mn, 17.1%), Texas (1.49 mn, 13.8%), and New York (1.43 mn, 18,7%). However, states across the South have relatively high enrollment rates driven by lower incomes and higher per-capita poverty rates. This trend is exemplified in states like Mississippi (.218 mn, 19.3%), Alabama (.366 mn, 18.6%), and an extreme outlier, Louisiana (.474 mn, 26.6%). The Rust-belt region also has high enrollment, including states like Ohio (1.00 mn, 20.7%) and Kentucky (.404 mn, 22.6%).
Furthermore, states like Ohio (20.7%), New Mexico (20.2%), and Kentucky (22.6%) have greater enrollment, which is also an indicator of improved broadband access (comparatively with the pre-ACP period). Households without access to broadband providers gain no additional utility in enrolling in a subsidy program for broadband.
From this, we see that there is a relationship - states like Montana ($11,900 per unenrolled household, 10.7% ACP enrollment), Wyoming ($13,800 per unenrolled household, 7.63% ACP enrollment), and West Virginia ($10,300 per unenrolled household, 15.5% enrollment) are receiving a large amount of funds to deploy broadband while having relatively low ACP enrollment.
This pattern persists through other states, with BEAD funding per unenrolled household higher than the mean of $4,681, with an extreme case being Alaska ($38,800 per unenrolled household, 7.22% ACP enrollment). Households in states with higher-than-average BEAD funding are not enrolling in ACP because they do not have a wireline broadband connection to subscribe to. This pattern shows that the BEAD program is directing funds to provide broadband to states that lack access. In states that are receiving less BEAD funding per household than the mean, like California ($1,800 per household, 17% ACP enrollment) and Ohio ($1,400 per household, 20.7% enrollment), there is often higher ACP enrollment because the barrier becomes the price of broadband rather than access to it.
This trend continues in states that are smaller and wealthier, like Maryland ($1,300 per household, 11.5% ACP enrollment), New Jersey ($848 per household, 7.75% ACP enrollment), and Massachusetts ($609.70 per household, 11.5% ACP enrollment) because there is established broadband infrastructure and households are more able to pay for these services.
Then, there are several states with low median incomes, low BEAD allocation, and low ACP enrollment, like Iowa ($2,600 per household, 8% enrollment) and Illinois ($1,900 per household, 11.6% enrollment). These states could be outliers for several reasons, including low awareness of BEAD and ACP opportunities, low broadband demand, or lack of information about enrollment.
Nevertheless, we note a general pattern: Wealthy states often have low BEAD allocation and low ACP enrollment, suggesting high broadband connectivity and affordability. Some states have high BEAD allocation and low ACP enrollment, suggesting that many households are not connected to wireline broadband and that investments focus on broadband infrastructure. Other states have low BEAD allocation and high ACP enrollment, suggesting that the infrastructure is present, but a connection is not affordable.


This paper is available on arxiv under CC0 1.0 DEED license.

