Authors:
(1) Matthew Sprintson
(2) Edward Oughton
Table of Links
2. Literature Review
2.1 Reviewing Broadband Infrastructure’s Impact on the Economy
2.2 Previous Research into IO Modeling of Broadband Investment
2.3 Context of the Bipartisan Infrastructure Act through Previous Research
3. Methods and 3.1 Leontief Input-Output (IO) Modeling
3.2 Ghosh Supply-Side Assessment Methods for Infrastructure
4.2 What are the GDP impacts of the three funding programs within the Bipartisan Infrastructure Law?
5. Discussion
5.2 What are the GDP impacts of the three funding programs within the Bipartisan Infrastructure Law?
5.3 How are supply chain linkages affected by allocations from the Bipartisan Infrastructure Law?"
Acknowledgements and References
4.2 What are the GDP impacts of the three funding programs within the Bipartisan Infrastructure Law?
Via the model we specify, we estimate that the total macroeconomic impact of the US $59.7 billion direct federal investment allocated through programs of the Bipartisan Infrastructure Law could result in a total US $146 billion increase in GDP (subject to the methodology employed in this paper, and limitations discussed later). This constitutes .657% of the US GDP.
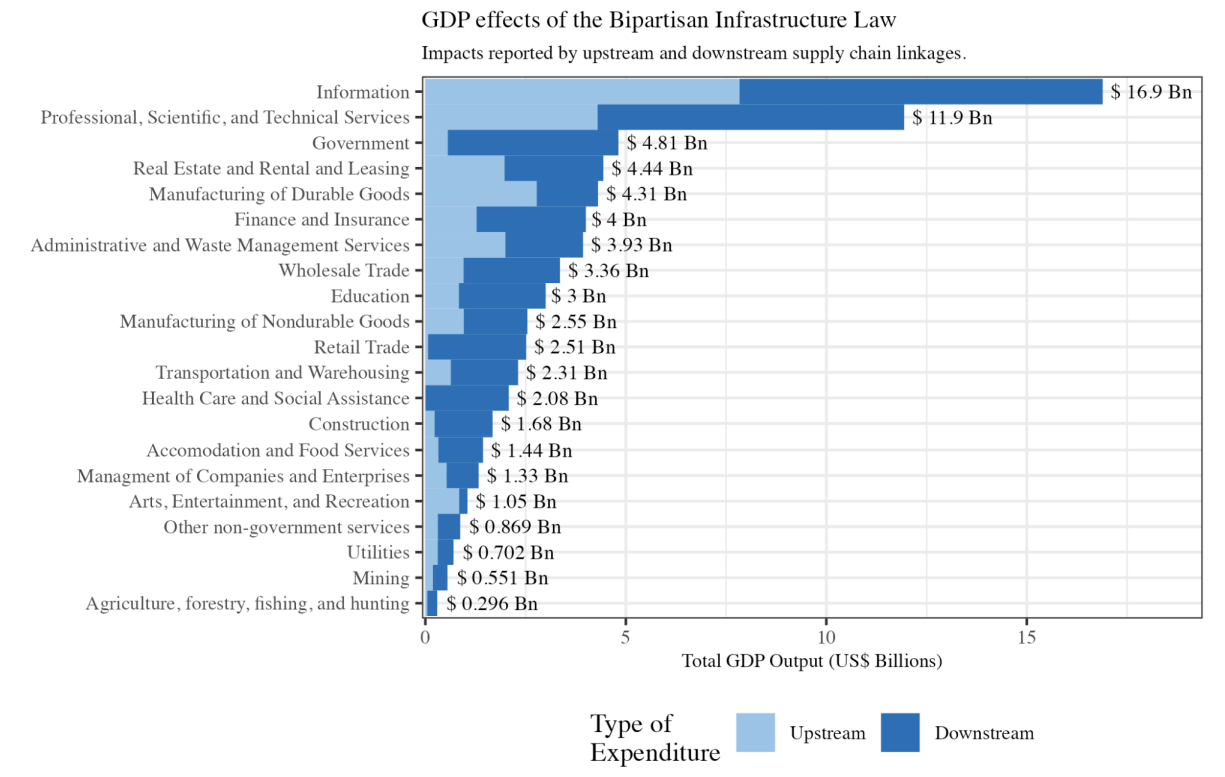
We visualize the potential upstream and downstream effects in Figure 3 by relevant NAICS code for the absolute macroeconomic impact in Billions, US$ (sectoral results reported in section 4.3). The upstream output consequences indicate industries that receive a positive economic activity impact as a result of increasing broadband demand. These are the industries that provide production impacts to the telecommunications sector to produce more infrastructure, from civil engineering (e.g., installing trenching/ducting) to electronics (active equipment, such as fiber optic, routers, etc.) to basic resource inputs (concrete, steel, etc.). In contrast, the downstream output consequences indicate industries that gain positive economic activity by utilizing broadband as a production input.
Our estimate suggests a direct impact of US $74.5 billion (0.319% of US GDP) from the three broadband investment programs and household spending, a US $90.7 billion (0.408%) implicit downstream benefit, and a US $ 26.1 billion (.117%) implicit upstream benefit.
Moreover, the model estimates that the BEAD Program may increase GDP by as much as US $84.8 billion (.381%), compared to a GDP increase for the American Connectivity Program by up to US $55.2 billion (.248%), and a GDP increase for the TBCP up to US $5.99 billion (.0269%)
When considering the package of all three initiatives, Figure 4 visualizes the total indirect macroeconomic impacts, reaching as much as US $116.8 billion. This translates to a Keynesian multiplier of 2.45 for the broadband investment associated with the Bipartisan Infrastructure Law. Specifically, this relates to Keynesian multipliers for the BEAD program of 2.00, the ACP program of 3.89, and the TBCP program of 2.00.
We can attribute ACP's high multiplier to the independent household investment that arises from the subsidy, as 48.8% is provided by the government and 51.2% is spent by households. When accounting for this, the overall Keynesian multiplier for the program and independent investment is 1.90, and the package has an estimated Keynesian multiplier of 1.96.

This paper is available on arxiv under CC0 1.0 DEED license.

